Key Indicators in Technical Analysis for Cryptocurrency Investors
Understanding Technical Analysis in Cryptocurrency Trading
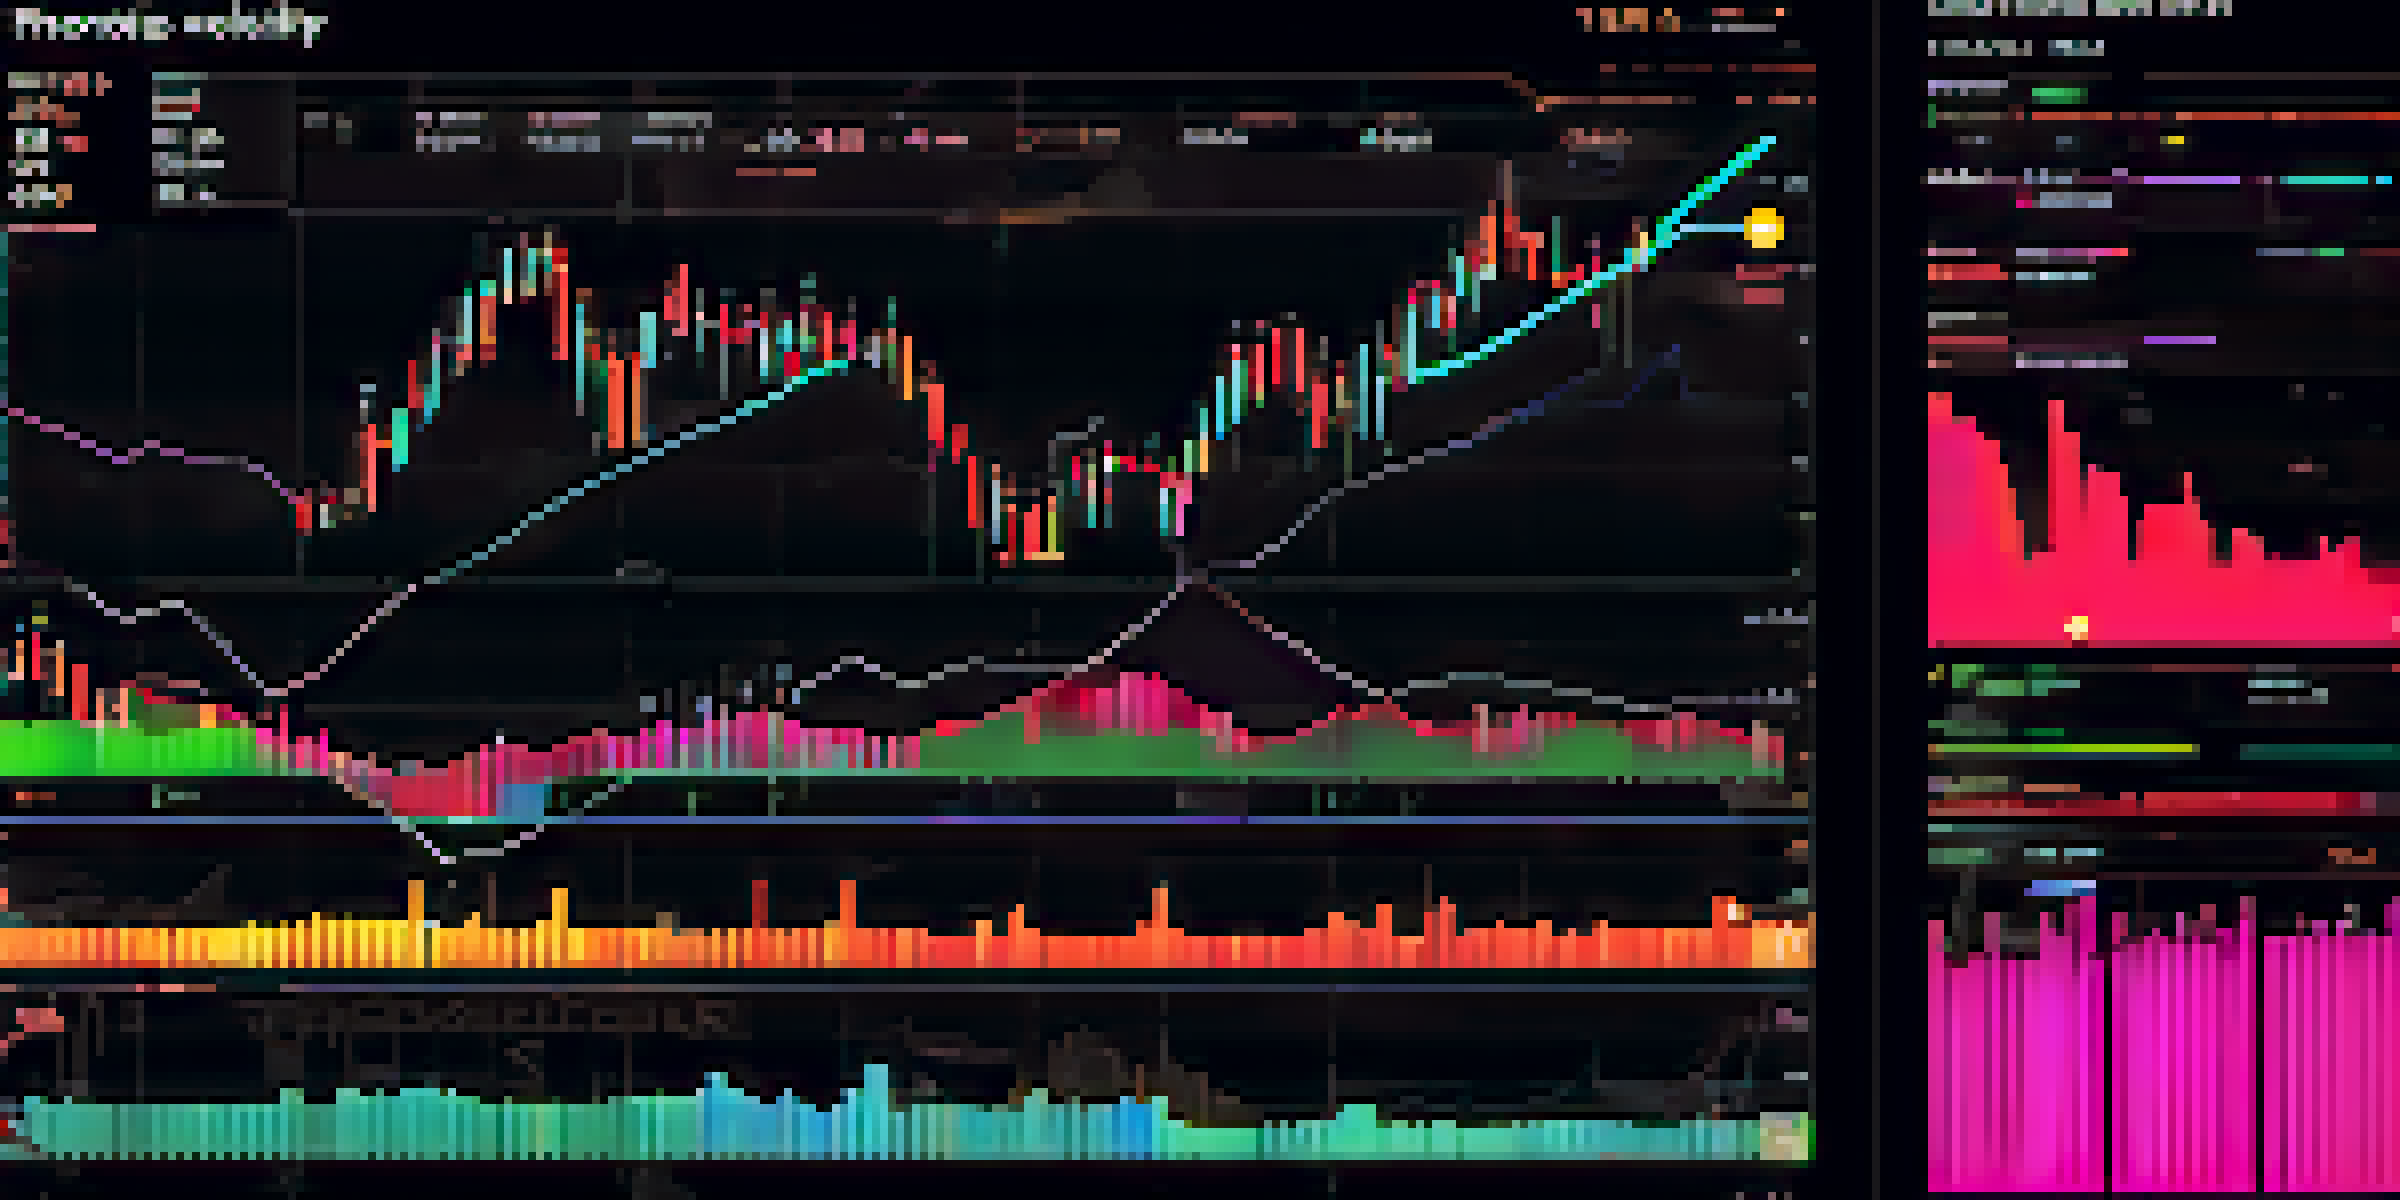
Technical analysis (TA) is a method used by traders to evaluate cryptocurrencies and predict future price movements. It relies on historical price data and trading volumes to identify patterns and trends. Unlike fundamental analysis, which focuses on the intrinsic value of an asset, TA emphasizes charting and statistical measures to make informed trading decisions.
In trading, it's not the strongest or the most intelligent who will survive but those who can best manage change.
For cryptocurrency investors, understanding technical analysis is crucial as the market is highly volatile and can change rapidly. By using TA, traders can better time their entries and exits, potentially maximizing profits while minimizing losses. It’s like having a map in a dense forest; it helps you navigate the uncertainties of the crypto market.
In this article, we will explore key indicators that can aid cryptocurrency investors in their trading strategies. These tools can provide insights into market trends, allowing you to make more informed decisions based on data rather than emotions.
Moving Averages: The Backbone of Trend Analysis
Moving averages (MAs) are one of the most widely used indicators in technical analysis. They smooth out price data over a specific period, making it easier to identify trends. For example, a 50-day moving average averages the closing prices of a cryptocurrency over the last 50 days, helping traders spot whether the asset is in an uptrend or downtrend.

There are different types of moving averages, with the Simple Moving Average (SMA) and Exponential Moving Average (EMA) being the most common. The EMA gives more weight to recent prices, making it more responsive to new information. This can be particularly useful in the fast-paced cryptocurrency market, where timely decisions are crucial.
Key Indicators for Crypto Trading
Understanding and utilizing technical indicators like moving averages and RSI can significantly improve your trading strategies.
By analyzing moving averages, investors can determine potential support and resistance levels. When the price crosses above the moving average, it may indicate a bullish trend, while a cross below could signal a bearish trend. This simple yet effective tool can be a game-changer for crypto traders.
Relative Strength Index (RSI): Measuring Market Momentum
The Relative Strength Index (RSI) is a momentum oscillator that measures the speed and change of price movements. Ranging from 0 to 100, the RSI helps traders identify overbought or oversold conditions in a cryptocurrency. An RSI above 70 typically indicates that an asset may be overbought, while an RSI below 30 suggests it may be oversold.
The market is a device for transferring money from the impatient to the patient.
Using the RSI can help investors make timely decisions to enter or exit trades. For instance, if a cryptocurrency is oversold, it might present a buying opportunity, while an overbought signal could be a cue to sell. It’s like checking the temperature before deciding to go for a swim; it helps gauge whether the market conditions are right.
However, it’s important not to rely solely on the RSI. Combining it with other indicators, like moving averages, can provide a more comprehensive view of market conditions. This multi-faceted approach can enhance your trading strategies and increase your chances of success.
Bollinger Bands: Understanding Price Volatility
Bollinger Bands are a popular tool that combines a moving average with two standard deviations, creating a band around the price of a cryptocurrency. This indicator helps traders visualize price volatility and potential price reversals. When the price touches the upper band, it may indicate overbought conditions, while touching the lower band may signal oversold conditions.
One of the strengths of Bollinger Bands is their ability to adapt to changing market conditions. In periods of high volatility, the bands widen, while they contract during low volatility periods. This dynamic nature allows traders to adjust their strategies based on the current market environment.
Volume Analysis Helps Confirm Trends
High trading volume can indicate strong market interest, confirming trends identified by other technical indicators.
By using Bollinger Bands alongside other indicators, investors can gain deeper insights into price movements. This can lead to more informed trading decisions, as many traders look for price action that interacts with the bands to signal potential entry or exit points.
MACD: A Comprehensive Trend-Following Indicator
The Moving Average Convergence Divergence (MACD) is a powerful trend-following momentum indicator. It consists of two moving averages and a histogram that shows the difference between them. The MACD line and the signal line help traders identify potential buy and sell signals based on crossovers.
When the MACD line crosses above the signal line, it may signal a bullish trend, while a crossover below can indicate a bearish trend. Additionally, the histogram provides insight into the strength of the trend; a growing histogram suggests increasing momentum. This makes MACD a valuable tool for predicting potential reversals.
However, like other indicators, MACD should not be used in isolation. Combining it with other indicators can provide a more rounded perspective on market conditions. By understanding how MACD works, investors can enhance their trading strategies and make more informed decisions.
Volume Analysis: The Heartbeat of Market Activity
Volume analysis is crucial in technical analysis as it reflects the number of shares or contracts traded in a specific period. High trading volume often indicates strong market interest and can confirm trends identified by other indicators. For instance, if the price of a cryptocurrency rises with increasing volume, it may suggest a strong bullish trend.
Conversely, if the price rises but volume is low, it may indicate a lack of conviction, signaling a potential reversal. This is similar to a concert; if the crowd is roaring, the energy is high, but if only a few people are clapping, the excitement might be waning. Understanding volume trends can help investors gauge the strength behind price movements.
Fibonacci Levels Indicate Reversals
Fibonacci retracement levels can help identify potential support and resistance points during price movements.
Incorporating volume analysis into your trading strategy can provide additional context to price changes. By combining volume with other indicators, traders can make more informed decisions and improve their chances of success in the volatile cryptocurrency market.
Fibonacci Retracement: Identifying Support and Resistance Levels
Fibonacci retracement levels are a popular tool used to identify potential support and resistance levels in the market. Based on the Fibonacci sequence, these levels are drawn horizontally on a chart at key percentages (23.6%, 38.2%, 50%, 61.8%, and 100%) of a price move. Traders often use these levels to predict potential price reversals during a retracement.
When the price approaches a Fibonacci level, it can indicate a possible reversal point. For example, if a cryptocurrency is retracing after a significant uptrend and approaches the 61.8% level, it may find support there. This concept is similar to finding a comfortable spot to rest; the price often 'pauses' at these levels before deciding its next move.

While Fibonacci retracement is a valuable tool, it’s best used in conjunction with other indicators for confirmation. By combining this technique with trend analysis and volume, investors can enhance their trading strategies and make more informed decisions.
Conclusion: Building a Robust Trading Strategy with Indicators
In conclusion, utilizing key indicators in technical analysis can significantly enhance your trading strategies in the cryptocurrency market. From moving averages to volume analysis, each tool offers unique insights that can help you make informed decisions. By understanding these indicators and how they interact with each other, you can better navigate the complexities of crypto trading.
It’s important to remember that no single indicator is foolproof. Instead, consider a multi-faceted approach that combines various tools to create a comprehensive trading strategy. This way, you’re better equipped to handle the volatility and unpredictability of cryptocurrency markets.
As you continue to explore and implement these technical indicators, remember to stay patient and disciplined. Successful trading often comes down to consistent strategy and sound decision-making, so keep learning and adapting to the ever-changing landscape of cryptocurrency investing.