How to Read Crypto Charts: A Beginner's Guide to Analysis
Understanding the Basics of Crypto Charts
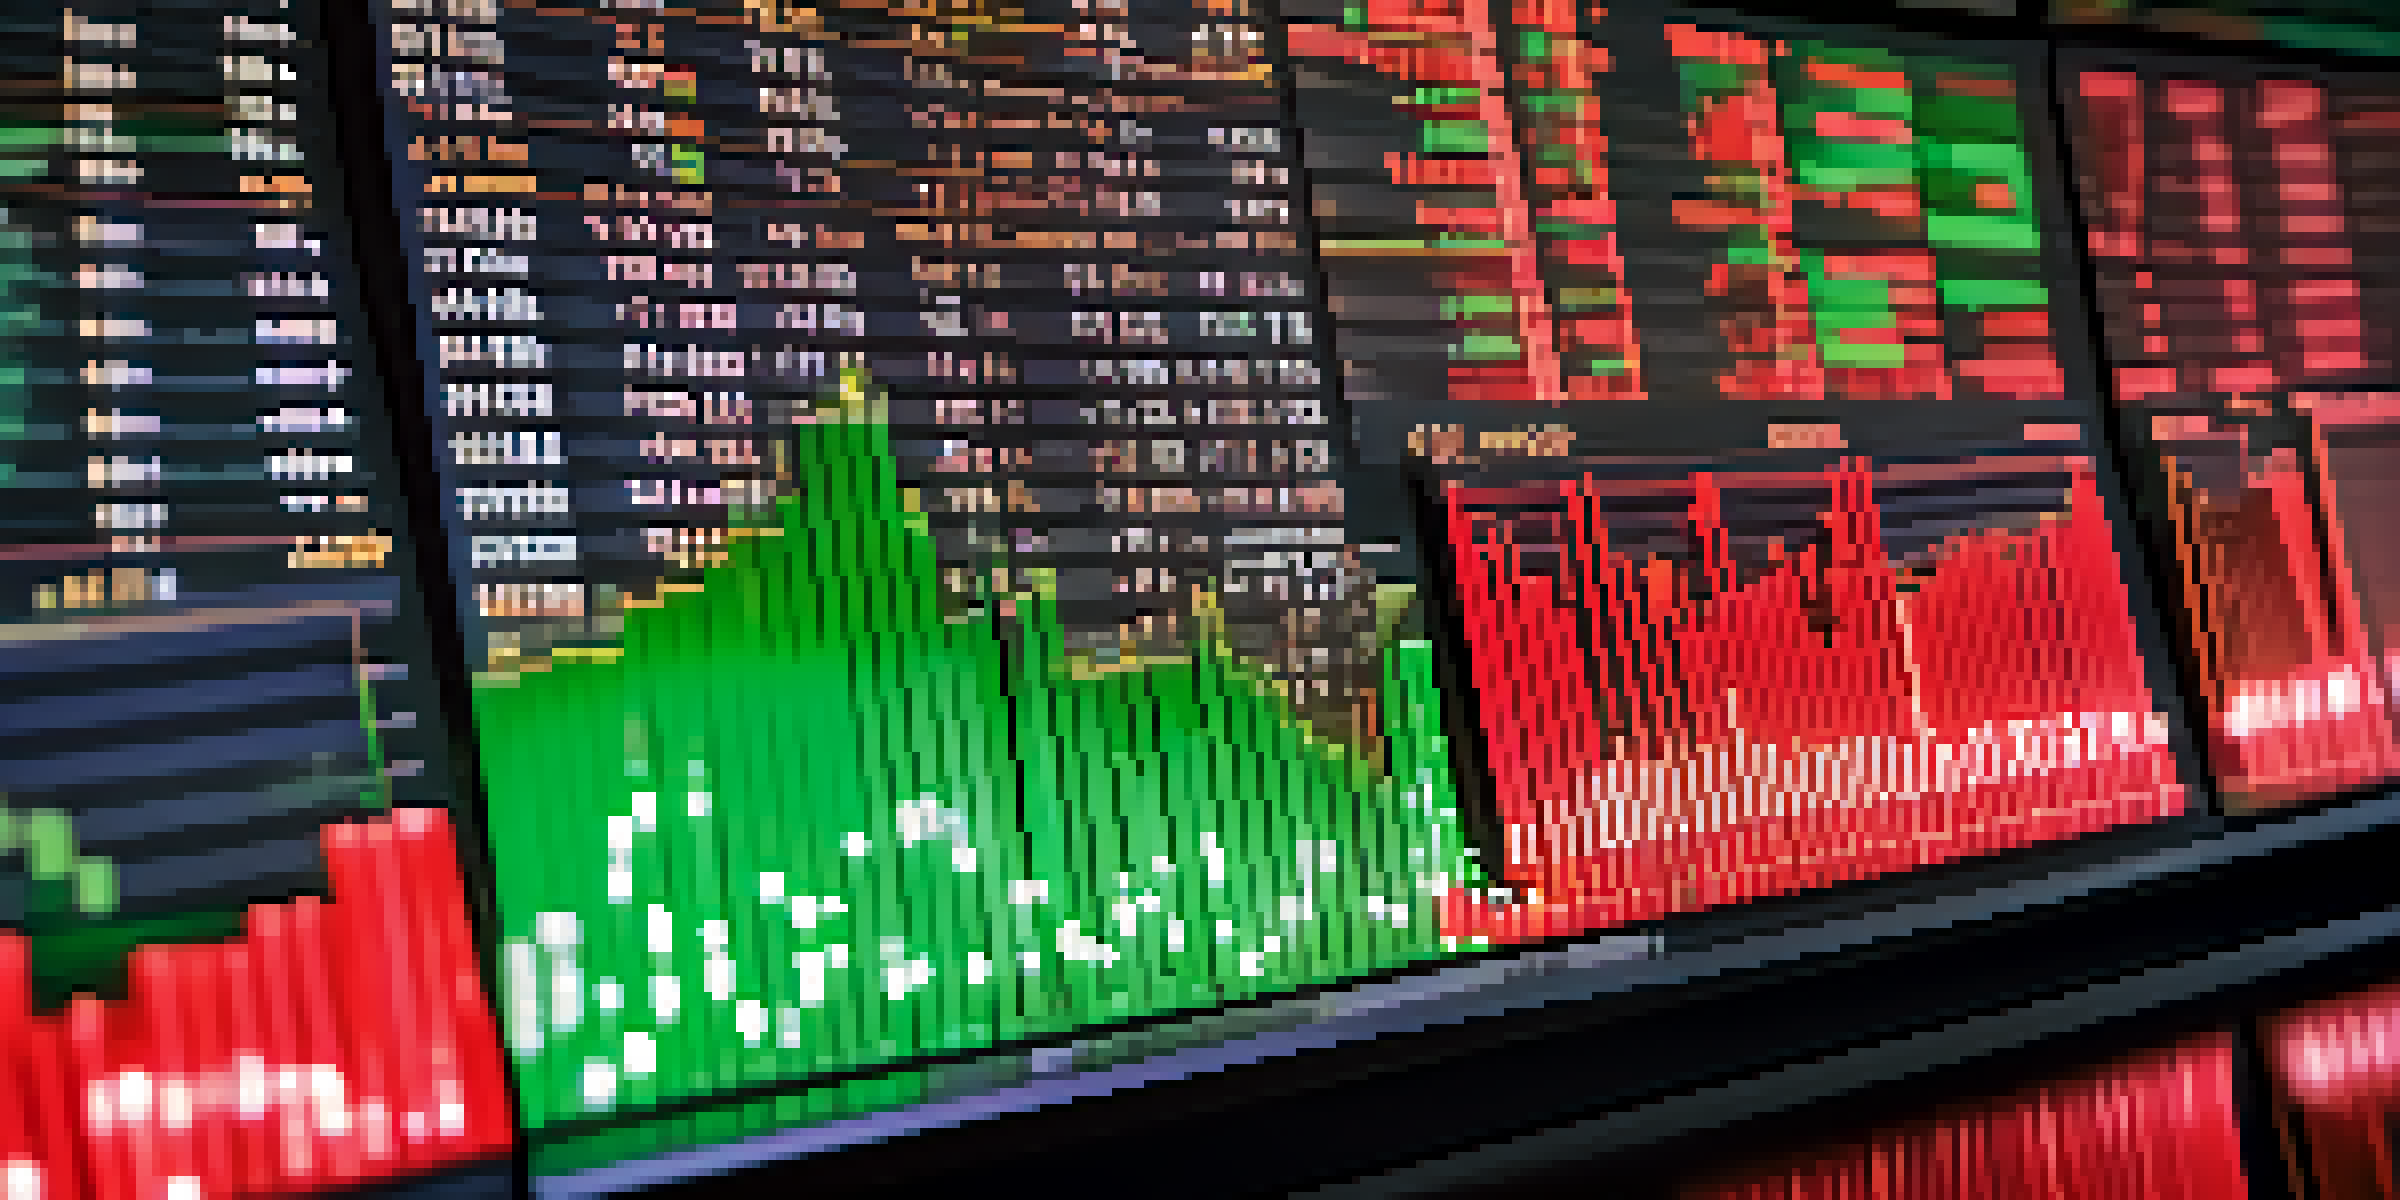
Crypto charts are visual representations of a cryptocurrency's price movements over time. They can look intimidating at first, but they provide valuable insights into market trends. Understanding these basics is crucial for making informed trading decisions.
In investing, what is comfortable is rarely profitable.
At the core, every chart displays price on the vertical axis and time on the horizontal axis. This simple layout helps you track how a cryptocurrency's value changes over days, weeks, or even months. As you familiarize yourself with this structure, it becomes easier to interpret the data presented.
The most common types of charts you'll encounter are line charts, bar charts, and candlestick charts. Each type has its unique way of conveying price information, but all serve the same purpose: helping you visualize and analyze market movements.
Key Components of Crypto Charts Explained
Every crypto chart has essential components that provide context to the data. These include the price scale, time frame, and volume indicators. Understanding each component is vital for effective analysis and decision-making.

The price scale indicates the value of the cryptocurrency, while the time frame shows the period over which the data is collected. By adjusting these parameters, you can zoom in or out on price movements, allowing you to analyze short-term fluctuations or long-term trends.
Basics of Crypto Charts Simplified
Understanding the basic structure and types of crypto charts is essential for making informed trading decisions.
Volume indicators are another critical aspect of charts, representing the number of coins traded during a specific period. High trading volume often accompanies significant price movements, providing clues about market sentiment. Keeping an eye on volume helps you gauge the strength of a price trend.
Deciphering Candlestick Patterns
Candlestick charts are popular among traders for their rich information. Each candlestick represents price movements over a set time frame, with the body showing the opening and closing prices, and the wicks indicating the highest and lowest prices during that period.
The market is a device for transferring money from the impatient to the patient.
Recognizing patterns in candlestick formations can offer insights into potential price reversals or continuations. For instance, a bullish engulfing pattern suggests that buyers may be gaining control, while a bearish engulfing pattern indicates the opposite.
As you become more familiar with various candlestick patterns, you'll start to see how they can inform your trading strategy. The key is to practice identifying these patterns and consider them alongside other indicators for a well-rounded analysis.
Moving Averages: The Trend's Best Friend
Moving averages are essential tools for identifying trends in crypto charts. They smooth out price data over a specified period, making it easier to spot upward or downward trends without the noise of daily price fluctuations. The two most common types are the simple moving average (SMA) and the exponential moving average (EMA).
The SMA calculates the average price over a specific number of days, while the EMA gives more weight to recent prices, making it more responsive to new information. Both moving averages can help traders determine entry and exit points, providing a clearer picture of market momentum.
Key Indicators Enhance Analysis
Utilizing key components like volume and moving averages can provide deeper insights into market trends.
By analyzing crossovers between short-term and long-term moving averages, traders can make informed decisions. For example, when a short-term average crosses above a long-term average, it can signal a buying opportunity.
Understanding Support and Resistance Levels
Support and resistance levels are crucial concepts in technical analysis that help traders understand potential price barriers. Support refers to a price level where buying interest is strong enough to prevent the price from falling further. Conversely, resistance is a level where selling interest is sufficient to stop the price from rising.
Identifying these levels can help you make strategic trading decisions. For instance, if a price approaches a support level, it may be a good opportunity to buy, anticipating a bounce back. On the other hand, if the price hits a resistance level, it might be wise to consider selling to capitalize on potential declines.
Traders often use historical price data to identify these key levels, looking for areas where the price has previously reversed. Continuously monitoring these levels can help you stay ahead of market movements.
The Role of Volume in Price Movements
Volume is a critical indicator in crypto trading, reflecting the number of assets traded over a specific period. It offers insights into the strength of a price movement, indicating whether a trend is likely to continue or reverse. High volume often accompanies significant price changes, signaling strong market interest.
When analyzing volume, pay attention to spikes or drops, as these can indicate shifts in market sentiment. For example, if the price of a cryptocurrency is rising alongside increasing volume, it suggests a strong bullish sentiment. Conversely, if the price rises but volume declines, it might indicate weakening momentum.
Practice Improves Chart Skills
Regular practice and engagement with trading communities can significantly enhance your ability to analyze crypto charts.
Incorporating volume analysis with other indicators, such as price trends and candlestick patterns, can enhance your trading strategy. It provides a more comprehensive view of market dynamics, allowing for better-informed decisions.
Using Technical Indicators for Better Insights
Technical indicators are mathematical calculations based on price, volume, or open interest, used to forecast future price movements. Some popular indicators include the Relative Strength Index (RSI), Moving Average Convergence Divergence (MACD), and Bollinger Bands. Each indicator serves a specific purpose in your analysis toolkit.
For example, the RSI measures the speed and change of price movements to identify overbought or oversold conditions. A high RSI suggests that a cryptocurrency may be overbought, while a low RSI indicates it could be oversold. This information can guide your trading decisions, helping you identify potential entry or exit points.

It's important to remember that no single indicator should be used in isolation. Combining multiple indicators can provide a more accurate picture of market conditions, allowing you to make more confident trading choices.
Practicing Your Analysis Skills
Like any skill, analyzing crypto charts takes practice. Start by familiarizing yourself with different chart types and indicators, and try to make sense of historical price movements. This hands-on experience will increase your confidence and understanding of market dynamics.
Consider using demo trading platforms that allow you to practice without risking real money. These platforms often provide access to real-time charts and various technical indicators, making it easier for you to experiment with different strategies.
Join online communities or forums where you can share your analysis and learn from others. Engaging with fellow traders can provide valuable insights, helping you refine your skills and enhance your understanding of crypto chart analysis.